Update!
When I first converted my website to the
blogdown package I had a few things break, like this post, that I decided to just remove and revisit later. A couple days ago I was contacted on Twitter about this post and if it was still around. Nothing cures procrastination like a little bit of accountability.
Code
Before we start here are some really handy tips on the ggraph package key elements, nodes, edges, and layouts. I decided to do this in part to also teach myself the ggraph package because my mind struggles to grasp the concept of networks with nodes, and edges and those links I provided earlier helped a lot. We will be getting our data from a really cool Mental Floss article that you should give a read, A Visual Guide to All 37 Villains in the Batman TV Series.
library(rvest)
library(ggraph)
library(igraph)
library(tidyverse)

#rvest
chars<-read_html('http://mentalfloss.com/article/60213/visual-guide-all-37-villains-batman-tv-series')%>%
  html_nodes('#article-1 > div:nth-child(1) > div:nth-child(2) > div:nth-child(1) > div:nth-child(1) > div:nth-child(2) > h4')%>%
  html_text()%>%
  data.frame(stringsAsFactors = F)
chars$name<-sub(".+?. ","",chars$.)
chars$id<-as.integer(lapply(strsplit(chars$.,'. '),'[',1))

apps<-read_html('http://mentalfloss.com/article/60213/visual-guide-all-37-villains-batman-tv-series')%>%
  html_nodes('strong i')%>%
  html_text()%>%
  data.frame(stringsAsFactors = F)

apps$id<-seq(1:37)
villians<-inner_join(apps,chars,by = c('id'))
Now we need to clean and organize the data.
#massage data
raw.seasons<-separate_rows(villians,..x,sep = "SEASON ")
raw.seasons$..y<-as.integer(unlist(lapply(strsplit(raw.seasons$..x,' *'),'[',1)))
raw.seasons<-separate_rows(raw.seasons,..x,sep = "([^0-9])")
raw.seasons$..x<-as.numeric(raw.seasons$..x)
batman<-subset(raw.seasons,!is.na(..x))

#arrange to plot
names(batman)[1:4]<-c('from','season','char','to')
batman<-batman[,c('from','to','season','char')]
batman$to<-paste0(batman$season,batman$to)
batman$from<-batman$char
batman$from<-gsub(' \\(','\n\\(',batman$char) #this bit makes nice names
#create igraph object
graph<-graph_from_data_frame(batman)
V(graph)$degree<-degree(graph)
Data! Now the part I wanted to get to when I started this thing, the graph. There are a ton of ifelse statements to help customize the end points which makes the code look a little unwieldy but the end product looks great I think.
n.names<-grep("[[:digit:]]",V(graph)$name,value=T)

ggraph(graph,layout='fr') +
  geom_edge_link(aes(colour = factor(season)))+
  geom_node_point(aes(size=ifelse(V(graph)$name %in% n.names,1,degree)),
                  colour=ifelse(V(graph)$name %in% n.names,'#363636','#ffffff'),
                  show.legend = F)+
  theme_graph(background = 'grey20',text_colour = 'white',base_family="Roboto Light",
              base_size = 10,
              subtitle_size = 10,
              title_family = 'Roboto Slab',
              title_size = 22,
              title_face = "plain")+
  theme(legend.position = 'bottom')+
  scale_edge_color_brewer('Season',palette = 'Dark2')+
  geom_node_text(aes(label = name,fontface = 'bold'),
                 color = ifelse(V(graph)$name %in% n.names,'grey40','white'),
                 size = ifelse(V(graph)$name %in% n.names,1.75,2.5),repel = T,check_overlap = T)+
  labs(title = 'Batman Villains',subtitle = 'Plotting 37 Batman villains across 3 seasons with\nnode ends representing season & episode number',
       caption = 'ggraph walkthroughs available at: http://www.data-imaginist.com/\n Data from: http://mentalfloss.com/article/60213/visual-guide-all-37-villains-batman-tv-series')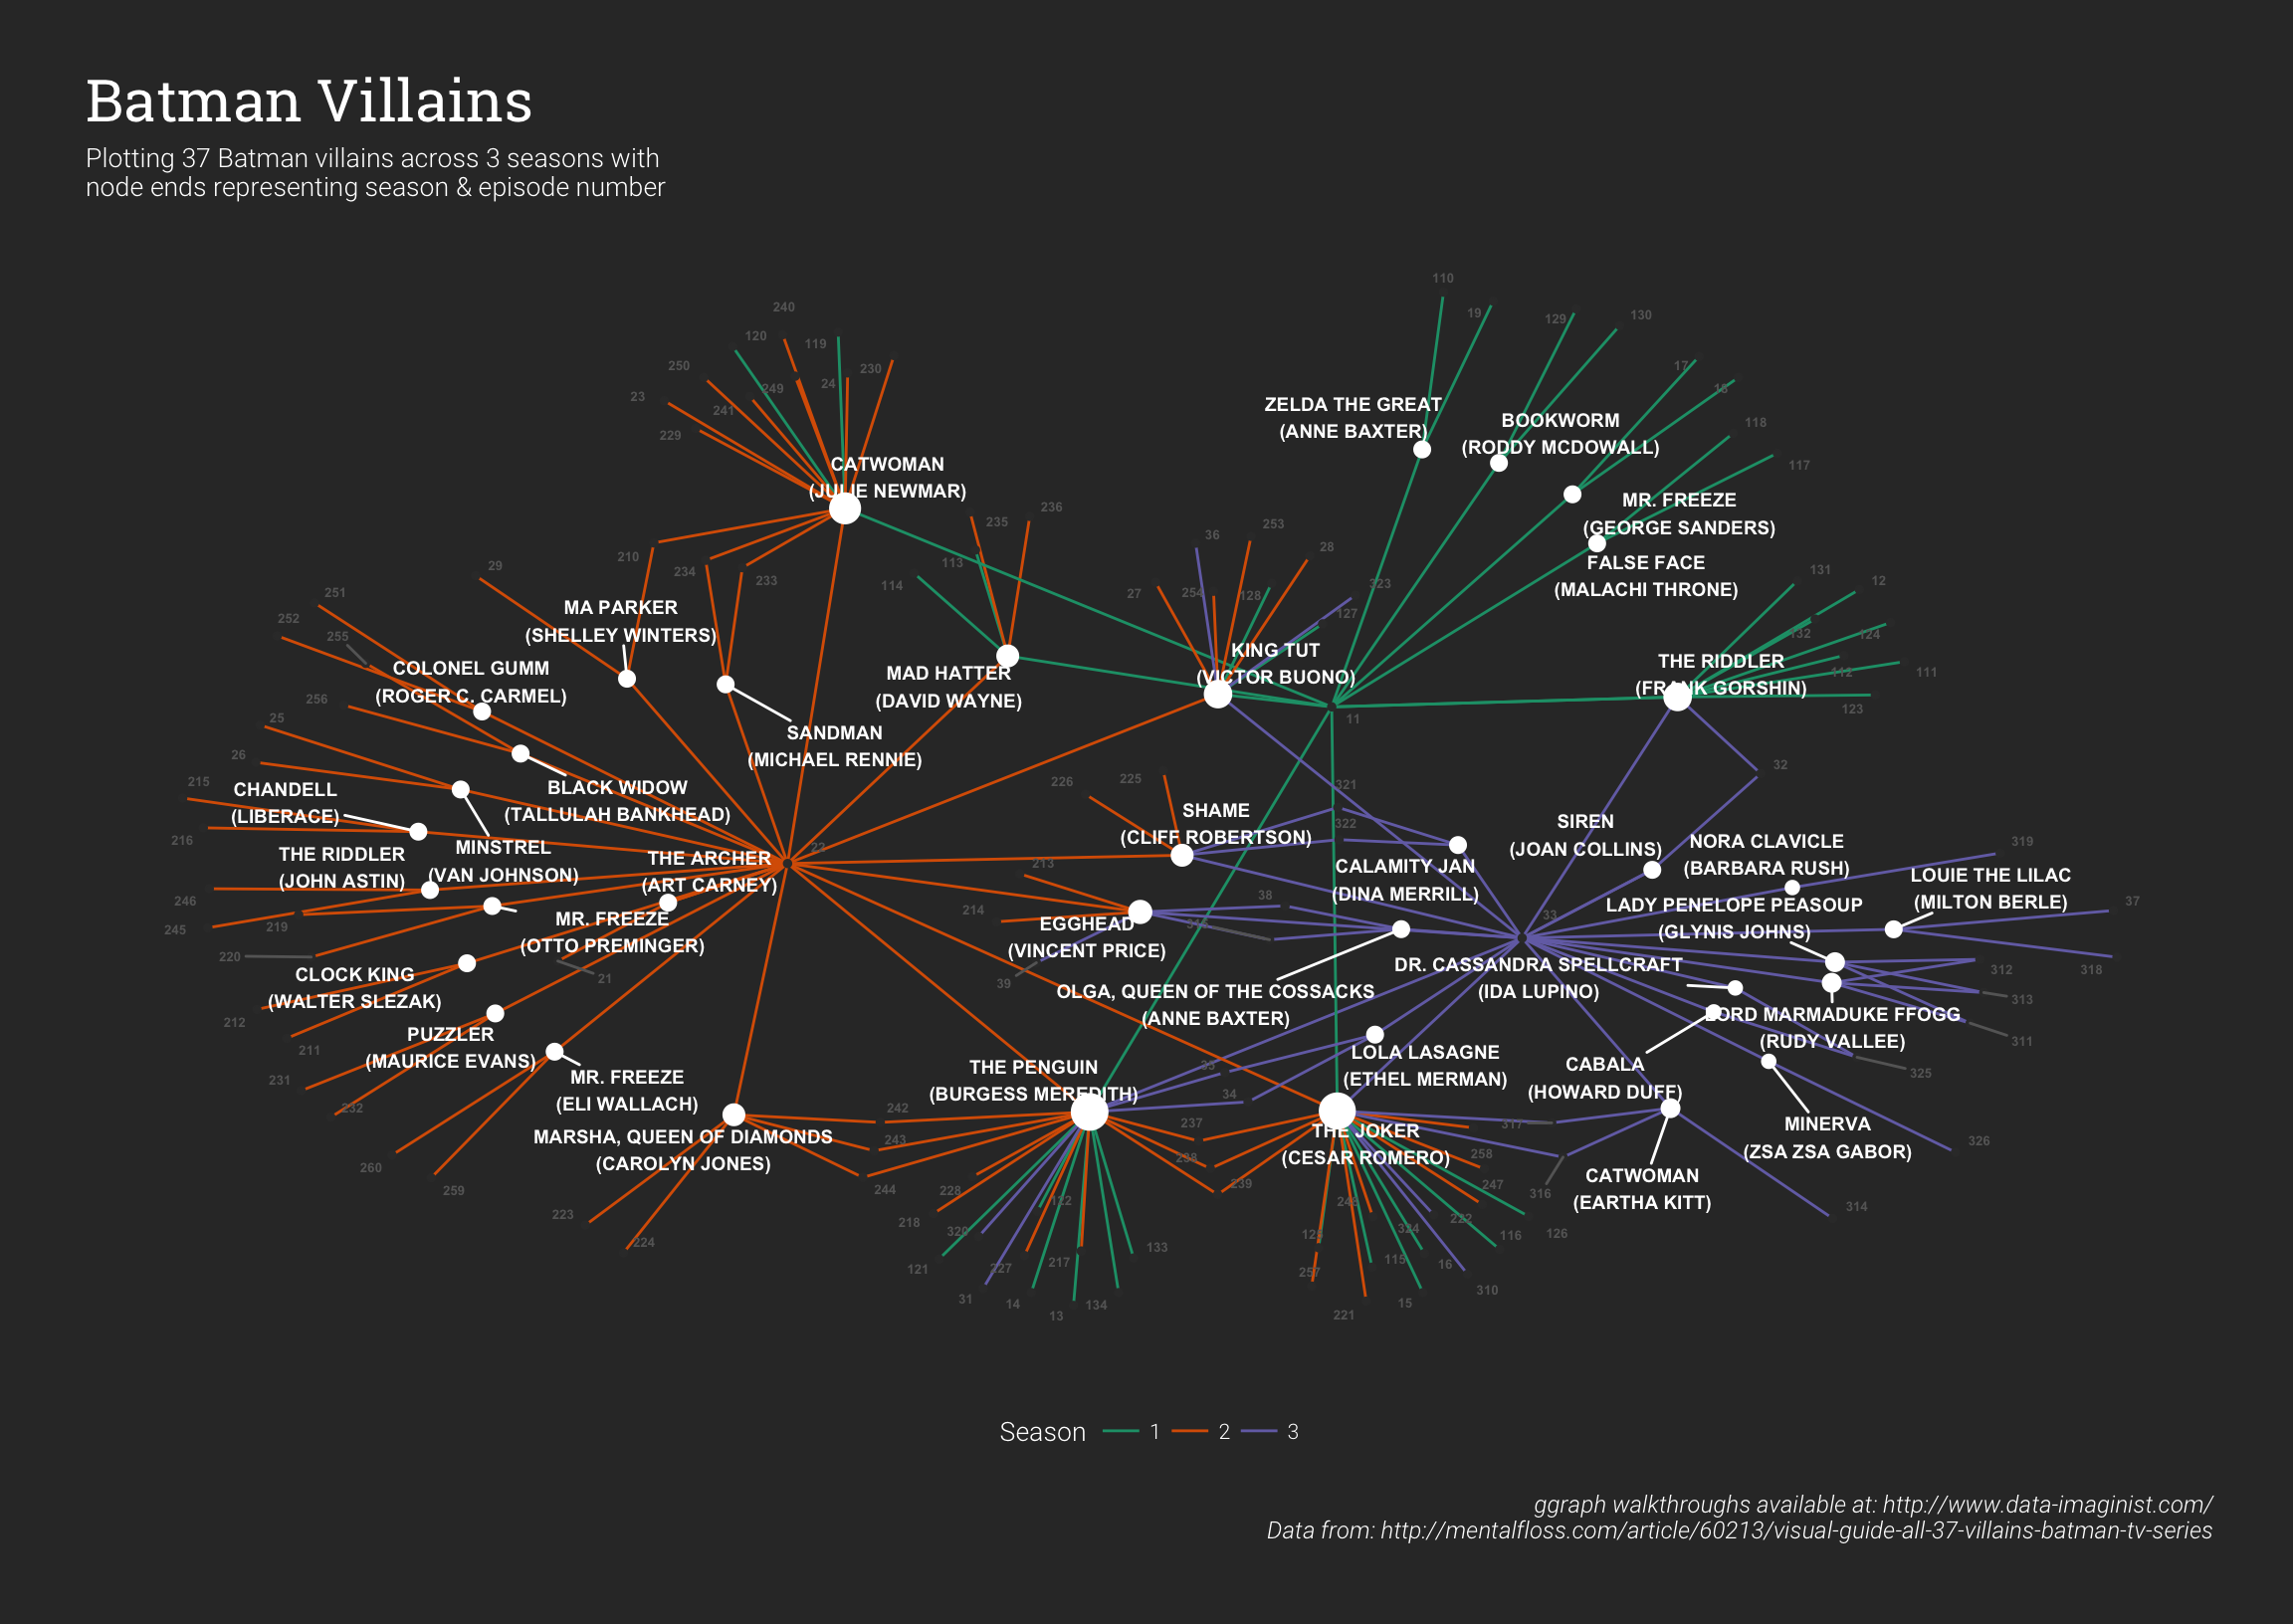
I think the question on everyone’s mind now is when are we getting that King Tut villain movie? As a final note, if you are part of the Twitter-verse I suggest giving the ggraph creator @thomasp85 a follow as well as @dataandme who provided the much needed push to get this back up.